I taught a course at UC Davis on applied topology in Fall 2016.
Course Objective
Computational topology gives students an opportunity to study topology — both algebraic and differential!! — using discrete, combinatorial techniques. It can provide a hands-on approach to naturally build up the intuition behind beautiful ideas such as co/homology groups and Morse theory. And as interesting as the pure problems in computational topology are, one cannot forget the powerful applications of computational topology found in topological data analysis, such as persistent homology and Reeb graphs.
The course was designed to be accessible to students with or without a background in general topology. Some experience in basic programming (in any language) was highly recommended but not required.
Course Outline
- Introduction, Triangulations, Topological Spaces, Manifolds
- Software: Hasse Diagrams
- Homology, Software: Persistent homology, Software: Persistent cohomology
- Discrete Morse theory, Software: Random_Discrete_Morse
- Software: Fundamental Group, Word Problem
- Software: Bistellar Simplification
- Reeb graphs
Student Projects
The students who registered for the class was a mixed batch. There were undergraduate and graduate students from mathematics, applied mathematics, statistics, computer science, even biology. From the first week, the students were assigned groups so that each group had a fair distribution of the different backgrounds. Each group had to work on some project which analyzed data using some topological method. The data was to be fairly big.
We had 5 student groups.
Group 1: Rice Genomics
The students in Group 1 analyzed Rice Genome Data from a publicly available source.
Group 2: Periodicity in Data
The students in Group 3 looked at crime statistics in Philadelphia.
Group 3: Albeck Data
Cells communicate with other cells by a process called signal transduction. When a molecule outside of some cell (ligand) penetrates (binds to a receptor on) the cell’s boundary (plasma membrane), it may trigger a biochemical chain reaction within the cell. This sequence of reactions is called the cell signaling transduction pathway of the initiating ligand. Certain pathways are known to cause the affected cell to produce (express) more or less of certain molecules.
Until very recently, microbiologists attempted to estimate the quantity of molecules expressed by a sample by computing averages. In these procedures, the sample cells had to be destroyed for the cell to reveal the molecules under investigation. Many cells were destroyed at once, the molecules were counted, then divided by the approximate number of cells in the sample. These procedures assume that all cells of the same sample express about an equal amount of the particular molecule and react to stimuli in the same way.
John Albeck et al. devised a new procedure to count these molecules. They first infect the sample cells with a virus which causes the molecule of interest – and only those molecules – to glow under certain wavelengths of light. They then take timed sequences of photos of the live sample cells over some extended period of time. The intensity of the glow corresponds to the quantity of that particular molecule. Their experiments confirmed what had long been suspected: individual cells react differently.
A sample video of this remarkable discovery can be found on their webpage.
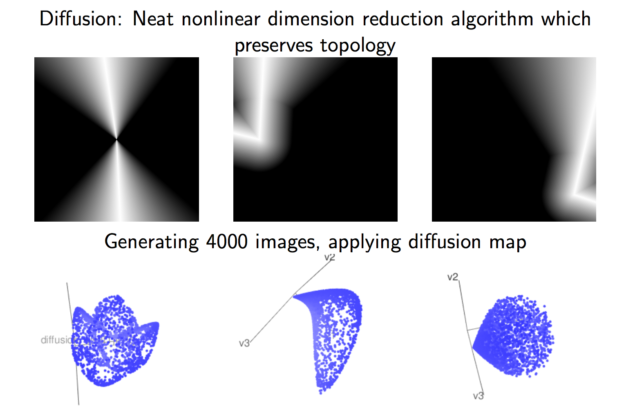
Group 4: Line/Angle Data
The students in Group 4 set out to analyze data consisting of 10×10 gray-scale pixels of randomly generated images depicting a white “angle” over a black background. They generated each image by first randomly selecting a point in the 10×10 grid that would be the “vertex” of the angle, then randomly chose two directions for the sides of the angle to extend in. Once they had the angle, they set the grayscale. Their parameters consist of width of the lines and noise for the grayscale.
Group 5: Financial Data
The students in Group 5 analyzed financial data consisting of trades and orders for various commodities, such as bonds, oil, and gold. The data contains both tick data (individual, timestamped orders/trades) and information aggregated over some fixed unit of time.